DCA Backtestingfor RecurringInvestment Strategies
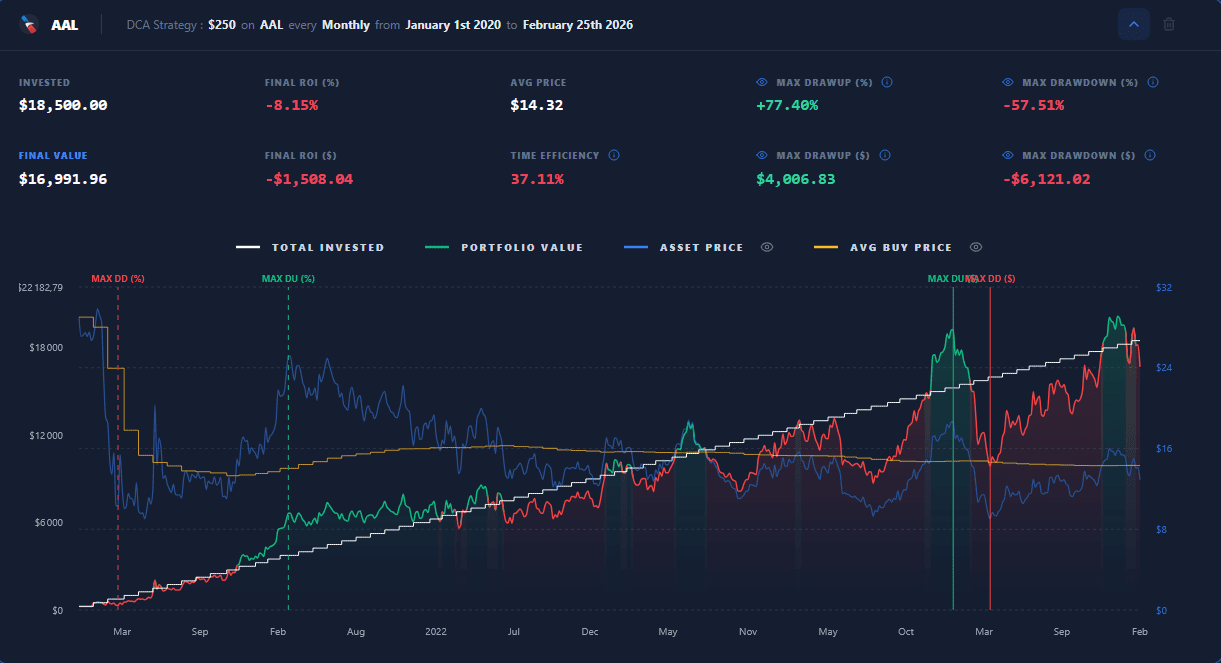
Backtest recurring investments against historical stock and crypto prices. Set your starting capital, contribution schedule and test period, then review invested capital, portfolio value, average purchase price, drawdowns and long-term compounding in one connected workflow.
See HowDCA BacktestingTurns a Plan Into Historical Results
Follow the workflow from asset and contribution settings to a historical portfolio path, drawdown review, lump sum comparison and compound growth projection.
A Smooth Return Assumption Cannot Show the Market Path
A compound projection is useful for understanding how time, contributions and an assumed return can affect long-term growth. It does not show the sequence of price changes that an investor would actually experience.
DCA results depend on when contributions occur, the prices paid and the drawdowns encountered along the way. Two periods with similar average returns can produce different portfolio paths, average purchase prices and investment experiences.
QuantikLab connects historical DCA backtesting with compound growth projections, so you can study both the path a strategy followed in the past and the assumptions behind a long-term scenario.
Test More Than a Final Portfolio Value
Historical DCA Backtesting
Run recurring investment schedules against historical market prices to see how the strategy would have developed across the selected period.
Flexible Contribution Plans
Set a starting amount, recurring contribution, investment frequency and test period to examine a scenario that matches the plan you want to study.
Portfolio Value and Average Price
Compare total invested capital with portfolio value, units accumulated and the average purchase price produced by the contribution schedule.
Drawdown and Lump Sum Comparison
Review how the portfolio moved through market declines and compare recurring investments with investing the available capital upfront.
Compound Growth Calculator
Model long-term growth with an assumed return and recurring contributions, then compare a smooth projection with the historical backtest.
Test the Strategy, Not Just the Final Number
A useful DCA analysis explains how the portfolio reached its result. QuantikLab helps you review contribution timing, average purchase price, drawdowns and the difference between historical performance and a constant-return projection.
Use the backtest to ask:
- How did the contribution plan behave during major drawdowns?
- How did investment frequency affect the units accumulated and average price?
- How much capital was contributed compared with the final portfolio value?
- How did DCA compare with investing the available capital upfront?
- How different was the historical result from a constant-return projection?
Who Is QuantikLab DCA Backtesting For?
Long-Term Investors
Study how regular contributions would have accumulated through different market conditions before committing to a long-term plan.
DCA Strategy Builders
Compare contribution amounts, frequencies and test periods to understand how each setting changes the historical result.
Stock and Crypto Investors
Backtest recurring investment ideas on supported stock and crypto assets using the same structured workflow.
Financial Planning Learners
Explore the difference between invested capital, market growth, drawdowns and compounding without treating a projection as a guarantee.
DCA Backtesting vs a Compound Calculator
Both tools answer useful but different questions. A compound calculator projects growth from an assumed return, while DCA backtesting applies your contribution plan to historical market prices and the volatility of the selected period.
| Comparison | Compound Calculator | DCA Backtesting |
|---|---|---|
| Return model | Assumed constant rate | Historical asset prices |
| Market volatility | Smoothed or simplified | Reflected in the tested period |
| Contribution timing | Mathematical schedule | Purchases at historical dates and prices |
| Average purchase price | Not based on market prices | Calculated from historical purchases |
| Drawdowns | Usually not represented | Measured along the portfolio path |
| Main purpose | Project a hypothetical future value | Study how a DCA plan behaved historically |
Historical Backtesting and Compound Projections in One Place
Historical Prices, Not Only an Annual Rate
Test recurring investments across real historical price movements instead of relying only on a smooth return assumption.
DCA and Compound Tools Connected
Move between a historical backtest and a hypothetical compound projection without rebuilding the same scenario in separate tools.
Clear Capital Breakdown
Separate the amount contributed from portfolio value and market growth to understand where the final result came from.
Scenario-Based Comparison
Adjust the plan, compare DCA with lump sum investing and examine how different assumptions change the outcome.
From an Investment Plan to a Historical Comparison
QuantikLab turns a recurring investment idea into a structured analysis through six clear steps:
Choose the asset and period
Select the stock or crypto asset and the historical window you want to examine.
Set the contribution plan
Define the starting capital, recurring amount and investment frequency for the scenario.
Run the historical backtest
Apply the contribution schedule to the historical prices available for the selected period.
Review the portfolio path
Examine invested capital, portfolio value, average purchase price and drawdowns over time.
Compare the alternatives
Contrast DCA with lump sum investing and a compound growth projection built from explicit assumptions.
Adjust and test again
Change the dates, contribution settings or assumptions and compare the new scenario with the previous result.
Historical results are not forecasts. They provide a clearer view of how a specific plan interacted with a specific market period.
DCA Backtesting FAQ
Backtest Your DCA StrategyWith Historical Market Data
Test recurring contributions, compare DCA and lump sum results, review drawdowns and explore compound growth assumptions in one connected workflow.